
The experiments have been carried out with a group of 30 volunteers within an age bracket of 19-48 years. Each person performed six activities (WALKING, WALKING_UPSTAIRS, WALKING_DOWNSTAIRS, SITTING, STANDING, LAYING) wearing a smartphone (Samsung Galaxy S II) on the waist. Using its embedded accelerometer and gyroscope, we captured 3-axial linear acceleration and 3-axial angular velocity at a constant rate of 50Hz. The experiments have been video-recorded to label the data manually. The obtained dataset has been randomly partitioned into two sets, where 70% of the volunteers was selected for generating the training data and 30% the test data.
This is 160-dimensional data, so my objectives are to reduce this dimensionality (through PCA) and to visualize the data. Hopefully this provides us greater insight into the problem!
Exploratory data Analysis
There are 160 different features, a lot of which can be removed for analysis. We can easily perform this reduction with the following regular expression:
regex = "^(X|user_name|raw_timestamp_part_1|raw_timestamp_part_2|cvtd_timestamp|new_window|num_window|kurtosis|skewness|min|max|stddev|total|var|avg|ampl)"
Automated Profiling
So the majority of the observations are missing, zero are too highly correlated to include in analysis. The correlation problem can be overcome by transforming those correlated variables using PCA (either dimensionality-reduction or just elimate correlation). Those variables that have high cardinality need to be standardized or normalized, therefore, it would probably be preferrable to scale all input features, then PCA them. In my personal opinion, zero values in features that are represented in 3-dimensional space is not a big problem, as zero is a feasible coordinate.
As suspected, the majority of variable observations are missing with only about 2% of all variables being complete. As stated above, there are over 100 computed metrics (like standard deviation), so we can remove these with a regular expression. This reduces the features from 160 down to 48
PCA
We can leverage PCA as well as clustering for dimensionality reduction. First let us compute the importance of each of the predictors. The roll_belt variable is by far the most “important.” Using this information in addition to some PCA we can get a better idea of which variables we should try and cluster. First we need to scale our data so that all units are the same. This can be done easily with Scikit-learn:
X_scaled = sklearn.preprocessing.scale(X)
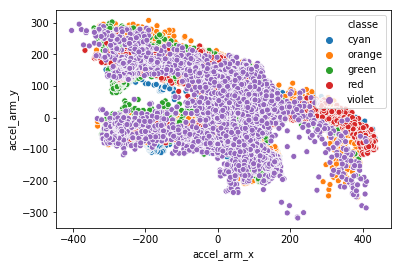
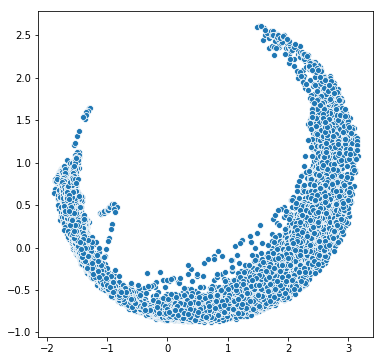
So it looks like after we transform the train data using PCA, we can then cluster the first 2 components to reduce accel_belt_(x, y, z) into one feature:
- Call this feature just accel_belt_cluster
- 3 to 1
- Features: 41 down to 39
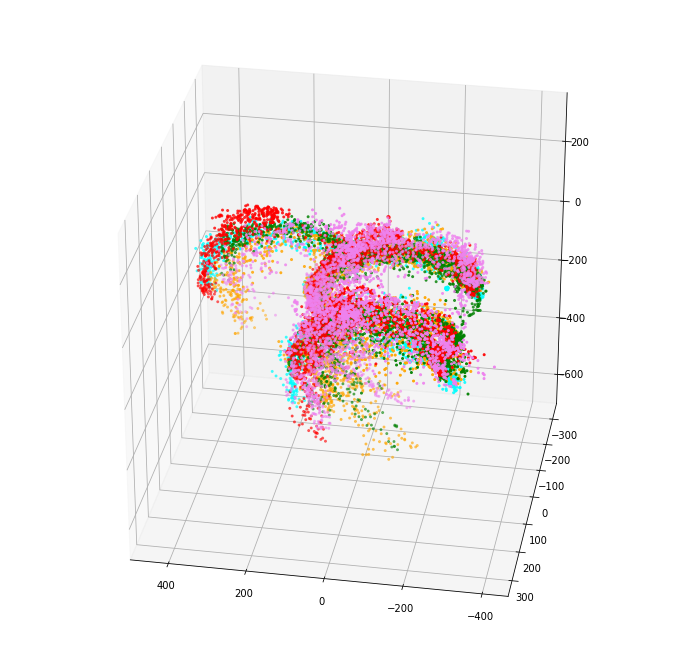
This same process can be applied to all other 3-dimensional measurements, note that not all can be reduced down to 1 component.
Conclusion
The original data contains 158 features. We implemented a few simple dimensionality reduction techniques:
- We first discarded non-relevant info like user_name and standard deviations (via regular expressions), bringing our total number of features down from 158 to 48
- 7 features had very little variance, so we discarded these as well 48 to 41
- Finally, we utilized PCA to reduce the set of features: * We can then replace all x, y and z tuples with it’s first 2 principal components. There are 10 such 3-tuples in the original data, and after discarding those features with low variance there are 8 (meaning 2 are simply tuples). Of these 8 component tuples, we can cluster all of them to further reduce dimensionality to 1-dimensional features. * Remember that we dropped gyros_dumbbell_y and gyros_forearm_x due to the low variance these features exhibited, and we can also cluster these into one feature
We end up with 26 features.
Source code can be found on GitHub